
Organization Network Analysis:
Scanning your Organization's Hidden Action Levers

It Began in Hollywood
Kevin Bacon’s Six Degrees (1994) board game added the celebrity fame to the organizational network analysis (ONA), now part of the OD practitioners’ tool. The game finds the shortest path between any given Hollywood actor who have appeared together with Kevin Bacon in a movie. It also gave way to the Bacon’s Law: all human beings are just six or fewer social connections away from each other.
What is ONA?
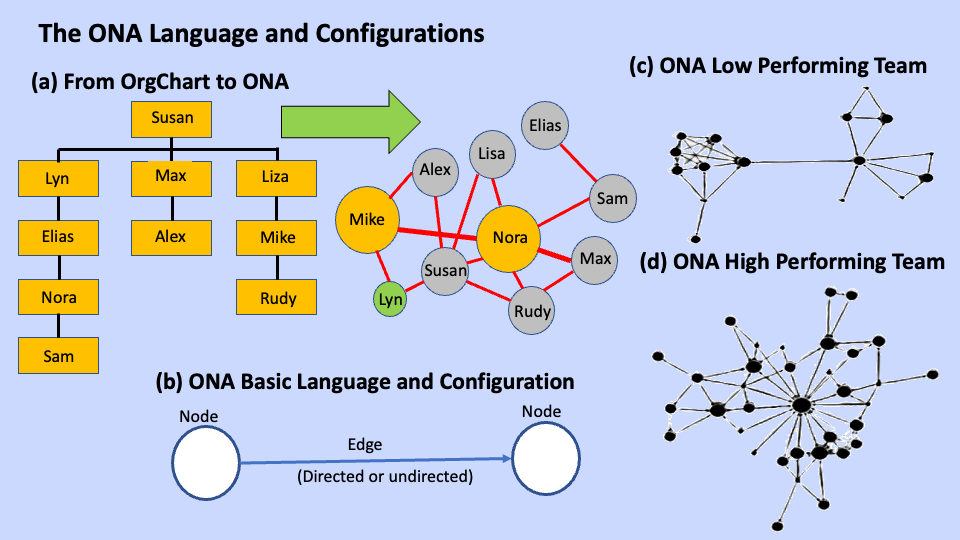
ONA scans the interaction patterns among people, teams, and other entities within organizations. By mapping the flows (information, resources, ideas, interactions, collaboration, energy, trust, rumors, viral infection, etc.), ONA can---like an MRI image---snaps how works actually gets done in organizations. And it is usually different from what the OrgCharts show. It captures the dynamics within by integrating the HR’s human capital with the social scientists’ relationship capital. This enables the practitioner to craft customized solutions with “surgical” precision with less unfavorable disruptions and consequences.
The Language
At its barest, ONA examines the relationships between two entities: consisting of nodes (from-to) and edges (or connections, that can either be directed or undirected) as depicted below.
Typical ONA questions revolve around “how to:” raise performance, accelerate innovations and knowledge sharing, lessen talents’ flight, capacitate newbies and teams, hasten digital or cultural transformation, profile customer experiences, and so many others.
Process-wise, ONA follows the OD’s 7-step action research: (a) confirm that ONA is the right diagnosis tool, (b) formulate the questions (and Q instruments), (c) determine population and fence the sample, (d) explain the process and obtain consent, (e) collect the data (or interviews), (g) map and analyze, and (h) recommend. Practitioners can use interviews or “rea-time” online data (e.g., exchanges of e-mails, social media posts, Google searches, etc.) to map the interaction frequencies BUT not their contents.
A subset of social network analysis (SNA), ONA data is processed by commercial and open-source software. They take large amounts of data, mines them (like Google) and traces hundreds of interactions to cull insights that would otherwise go unseen.
Action Levers
ONA identifies key organization action points including:
Connectors. Link the individuals, functions, departments, and desperate groups
within the organization. By facilitating information and resource flows, they create informal hubs for value creation, performance, organization learning and innovation. Hubs are ideal (and efficient) change champions or superusers. Over time, connected hubs can have significant influence over how the organization performs.
Gatekeepers. Experts blessed with lots of stock knowledge. They are comfortable working and exchanging information with their kind. They tell the connectors what’s new and hot. They want to educate, but not sell. Act as knowledge brokers between critical parts of the organization.
Influencers. Make everyone feel good about their high spirits, energy and verve. They move around a lot and easily build instant rapport and trust with others. They can be in a vantage position to exert maximum influence with minimum direct (and indirect) contacts to monitor the information flow. They know what is really happening in the organization. Usually, branded as: politicians, evangelists, pastors and salespeople.
Some Metrics
Likewise, ONA measures the interactions’:
Degree. The number of connections that an individual has to other nodes.
Betweenness. Extent to which an individual sits between other nodes considering the connectivity of the node’s neighbors. ONA gives higher values for nodes that bridge hubs
Closeness. Degree to which an individual is near (directly or indirectly) all other individuals reflecting their ability to access information through the “grapevine.”
ONA in Practice
Deloitte consulting shares a brief description of its Adaptable Organization Network Analysis (AONA) that scans the surface of the formal organization structure to uncover invisible networks and understand how people actually collaborate across functions and teams.
Benefits
In his over two decades of OD practice, Rob Cross reported that with more than 300 organizations, he found that 3-5% of people account for 20-35% of the value-adding collaborations. He observed that numerous “connectors” in organization are “not getting recognized so they often burn out and leave.” Identifying these people is the first step to leveraging and nourishing valuable but hidden talents.
ONA has many applications in organizations. Contact tracing, engagement metrics, people analytics, social media marketing, customer experience, as well other health and social concerns. Specifically, organizations can address specific challenges, including: (a) driving cultural alignment and agility, (b) promoting rapid innovation, (c) driving revenue growth, (d) improving performance through collaboration, (e) speeding merger integration, and (f) demolish data silos. With it, organizations can become data driven and gain better insights into the hitherto informal and mostly invisible performance and energy flows.
Your Takeaway
Imagine for a moment that Kevin is right! Is it possible that six or fewer people hold the superpowers to make or break your organization? Who can they be? Do you know them?
NOTES:
Source: Stephanie Blanda, The Six Degrees of Kevin Bacon
Source: Rob Cross
ODPN’s ODLab Planning is heating up. In fact, for the next issue, ODLab Program Manager, Bong Austero will describe the ODLab program in a full article. Watch for it!